Calculating structural properties
Quite often you want to calculate some geometric, structural properties of a
structure or set of structures, for example the mean bond angles between certain
species, or the polyhedral strain. This tutorial goes through various ways to
easily extract such quantities from .magres files.
As usual, we start by importing the MagresAtoms Python class and reading in a
.magres file to the atoms variable.
from magres.atoms import MagresAtoms
atoms = MagresAtoms.load_magres('../samples/T1Si0.magres')
Bond lengths
We can calculate the distance between two atoms, for example between the Al1 atom and its neighbour, the O1 atom.
atoms.dist(atoms.Al1, atoms.O1)
1.7623362335263948
We might then calculate the distance between Al1 and the Si1 atom bonded to the bridging O1 atom.
atoms.dist(atoms.Al1, atoms.Si1)
2.9562849997928144
Let’s loop over the first two aluminium atoms (for sake of space) and print out the Al-O bond length.
for atom_Al in atoms.species('Al')[:2]:
    for atom_O in atoms.species('O').within(atom_Al, 3.0):
        print atom_Al, atom_O, atoms.dist(atom_Al, atom_O)
27Al1 17O1 1.76233623353
27Al1 17O18 1.75419940144
27Al1 17O31 1.76324628229
27Al1 17O44 1.75655859851
27Al2 17O5 1.75237010931
27Al2 17O6 1.72876661236
27Al2 17O7 1.77878020002
27Al2 17O8 1.76119987509
We could take a mean to find out the average Al-O bond length, with a standard deviation.
dists = []

for atom_Al in atoms.species('Al'):
    for atom_O in atoms.species('O').within(atom_Al, 3.0):
        dists.append(atoms.dist(atom_Al, atom_O))

print "Mean bond length =", mean(dists), "+-", std(dists)
Mean bond length = 1.75230470421 +- 0.0209888992786
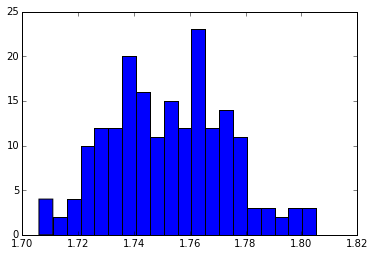
And we could even plot a histogram of the Al-O bond length distribution.
hist(dists, bins=20)
(array([  4.,   2.,   4.,  10.,  12.,  12.,  20.,  16.,  11.,  15.,  12.,
         23.,  12.,  14.,  11.,   3.,   3.,   2.,   3.,   3.]),
 array([ 1.70591764,  1.71088507,  1.7158525 ,  1.72081992,  1.72578735,
         1.73075478,  1.7357222 ,  1.74068963,  1.74565706,  1.75062449,
         1.75559191,  1.76055934,  1.76552677,  1.7704942 ,  1.77546162,
         1.78042905,  1.78539648,  1.7903639 ,  1.79533133,  1.80029876,
         1.80526619]),
 <a list of 20 Patch objects>)

Bond angles
We can use the angle function to calculate the X-Y-Z bond angle of three atoms, X, Y and Z. For example, the Al1-O1-S1 bond angle is
atoms.angle(atoms.Al1, atoms.O1, atoms.Si1)
2.1049612709736554
That’s in radians. If we want it in degrees, we can either do the maths or specify the degrees option.
atoms.angle(atoms.Al1, atoms.O1, atoms.Si1, degrees=True)
120.60539686528409
We could do a similar thing as we did with bond lengths to look at the Al-O-X bond angle distribution, where X is any second nearest neighbour.
angles = []

# Loop over every aluminium atom
for atom_Al in atoms.species('Al'):

    # Find all oxygens within 2.0 A of the Al atom, i.e. ones bonded
    for atom_O in atoms.species('O').within(atom_Al, 2.0):

        # Find all Si and Al within 2.0 of the bonded oxygen
        for atom_X in atoms.species('Si', 'Al').within(atom_O, 2.0):

            # Check that we haven't found the original Al atom! Otherwise angle will equal zero
            if atom_Al != atom_X:
                angle = atoms.angle(atom_Al, atom_O, atom_X, degrees=True)

                # Append it to our list
                angles.append(angle)

print "Mean bond angle =", mean(angles), "+-", std(angles)
Mean bond angle = 119.244646177 +- 5.4306395789
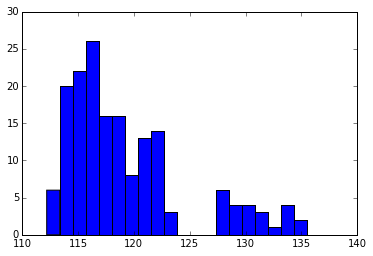
Plotting this distribution as a histogram we can see that there are two populations of bond angles, corresponding to the T1 (four-coordinated) and T2 (three-coordinated) sites.
hist(angles, bins=20)
(array([  6.,  20.,  22.,  26.,  16.,  16.,   8.,  13.,  14.,   3.,   0.,
          0.,   0.,   6.,   4.,   4.,   3.,   1.,   4.,   2.]),
 array([ 112.17244747,  113.33907751,  114.50570755,  115.67233759,
         116.83896763,  118.00559767,  119.17222771,  120.33885775,
         121.5054878 ,  122.67211784,  123.83874788,  125.00537792,
         126.17200796,  127.338638  ,  128.50526804,  129.67189808,
         130.83852812,  132.00515816,  133.1717882 ,  134.33841824,
         135.50504828]),
 <a list of 20 Patch objects>)
